绘图工具与实例:scienceplots
4 scienceplots
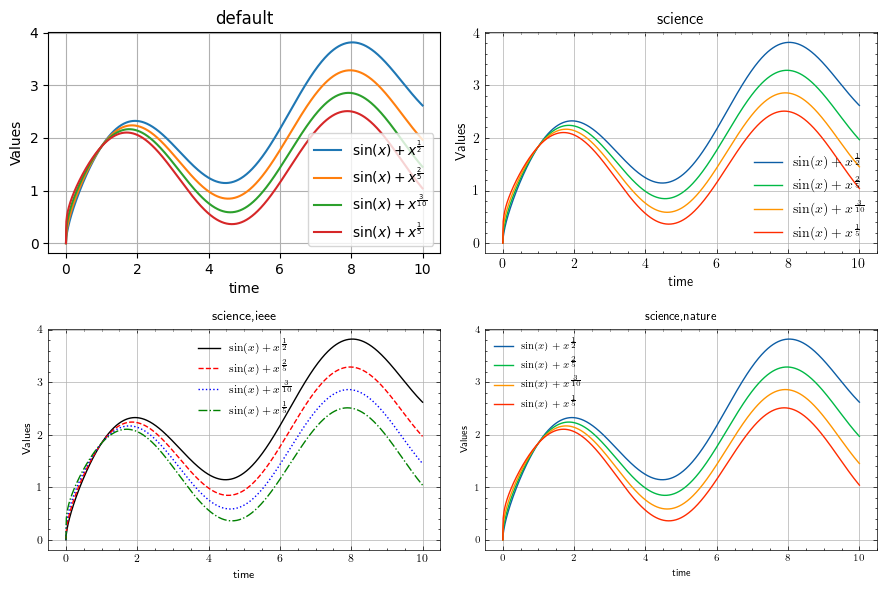
scienceplots是专门用于科研论文绘图的第三方扩展工具包。但用户需要根据期刊的绘制要求对配图进行微调与修改。scienceplot提供了主流英文科技期刊(如 Nature、IEEE、Science)的matplotlib图样式,只需在绘图之前指定matplotlib的绘图主题即可:
plt.style.use(["science"])plt.style.use(["science", "ieee"])plt.style.use(["science", "nature"]) |
scienceplots还支持一些内置的模式:
sciencegridscatternotebook(用于在 Jupyter 中绘制)ieee(用于 IEEE 期刊)nature(用于 Nature 期刊)bright(亮色)vibrant(鲜艳)muted(暗色)high-contrast(高对比度)light(亮色)std-colors(用于重载其他色系)high-visretro
在此主要选取期刊的绘图主题进行绘制。
import matplotlib.pyplot as pltimport scienceplotsimport numpy as npplt.figure(figsize=(9, 6))x = np.linspace(0, 10, 1000)y1 = np.sin(x) + x ** 0.5y2 = np.sin(x) + x ** 0.4y3 = np.sin(x) + x ** 0.3y4 = np.sin(x) + x ** 0.2themes = [None, ("science", ), ("science", "ieee"), ("science", "nature")]def plot_(ax, themes:tuple) -> None: ax.plot(x, y1, label=r"$\sin(x)+x^{\frac{1}{2}}$") ax.plot(x, y2, label=r"$\sin(x)+x^{\frac{2}{5}}$") ax.plot(x, y3, label=r"$\sin(x)+x^{\frac{3}{10}}$") ax.plot(x, y4, label=r"$\sin(x)+x^{\frac{1}{5}}$") ax.set_xlabel("time") ax.set_ylabel("Values") if themes is not None: ax.set_title(','.join(list(themes))) else: ax.set_title("default") ax.legend() ax.grid()for i in range(4): if themes[i] is not None: with plt.style.context(list(themes[i])): ax = plt.subplot(2, 2, i+1) plot_(ax, themes=themes[i]) else: ax = plt.subplot(2, 2, i+1) plot_(ax, themes=themes[i])plt.tight_layout() |