绘图工具与实例:proplot
3 Proplot
3.1 多子图绘制处理
3.1.1 共享轴标签
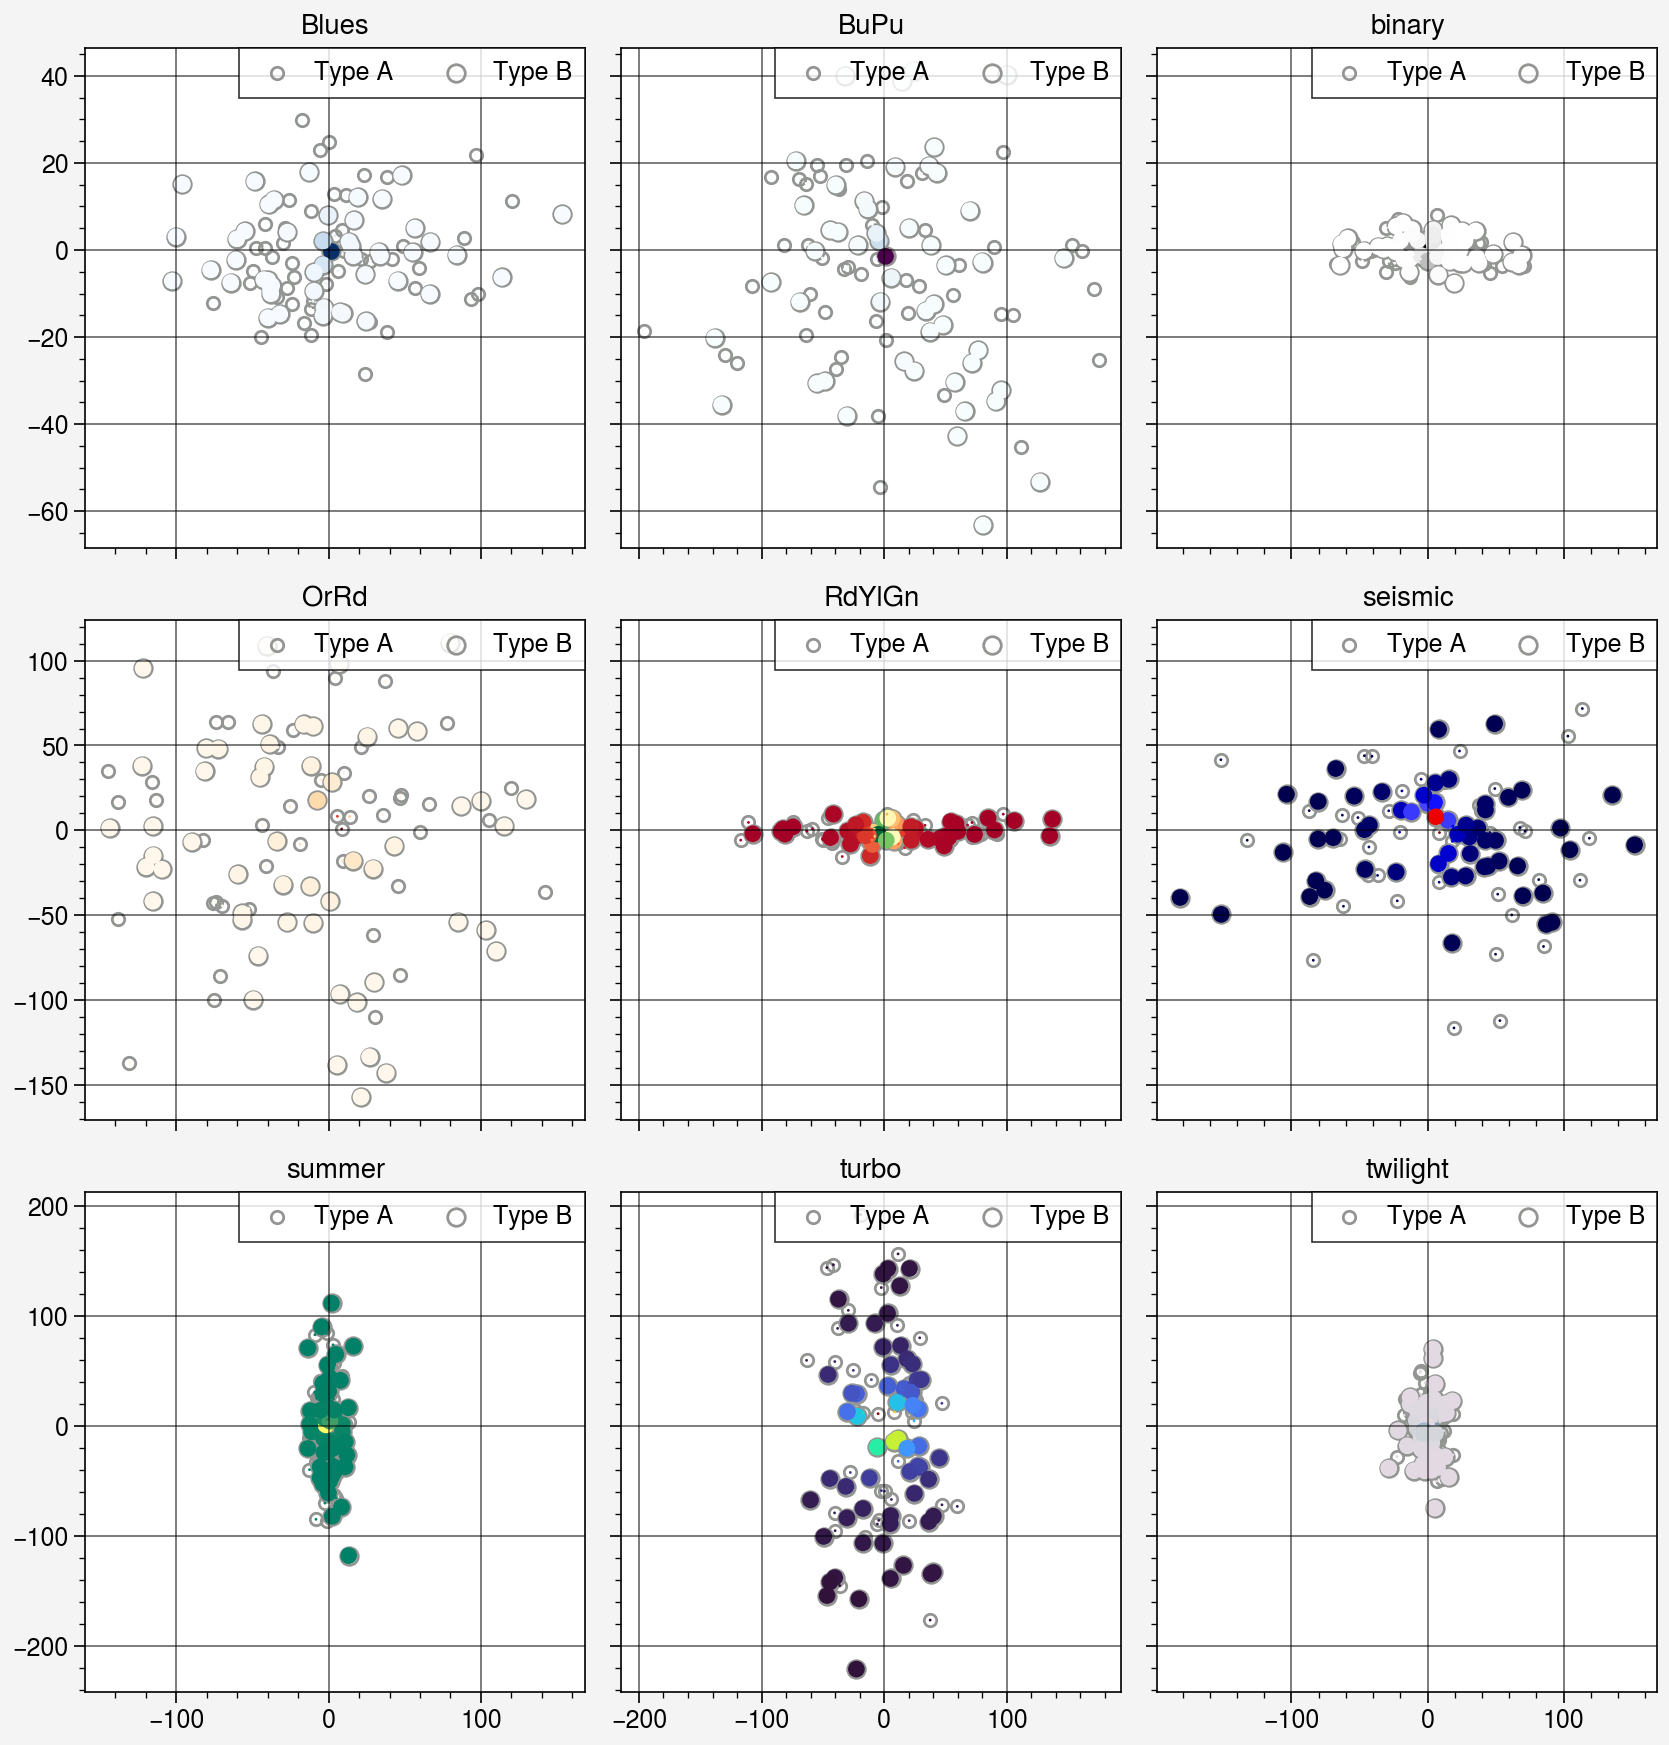
proplot中的figure()函数中的sharex,sharey和share参数可以控制不同的标签样式
| 可选值 | 说明 |
|---|---|
0 或 False |
没有轴标签共享 |
labels 或 labs |
仅在子图最下一行或最左一列绘制轴标签 |
limits 或 lims |
强制轴范围、比例和刻度位置相同,刻度标签依然在每个子图上都绘制 |
3 或 True |
共享轴、刻度标签仅出现在最下一行和/或最左一列 |
import proplot as pplimport matplotlib.pyplot as pltimport numpy as npfrom tqdm import tqdmcmaps = ['Blues', 'BuPu', 'binary', 'OrRd', 'RdYlGn', 'seismic', 'summer', 'turbo', 'twilight']plt.figure(figsize=(20, 16), dpi=300)ppl.figure(share=3)for idx, cmap in tqdm(enumerate(cmaps)): xs = np.random.randn(100) * np.random.randint(2, 100) ys = np.random.randn(100) * np.random.randint(2, 100) size_marker = np.random.rand(100) > 0.5 s = 40 - 20 * size_marker deg = 1 / (xs ** 2 + ys ** 2 + 1) ax = plt.subplot(3, 3, idx+1) ax = plt.scatter(xs, ys, c=deg, s=s ,cmap=cmap, linewidth=size_marker, edgecolor="None", zorder=-10); # plt.colorbar(ax) ax = plt.scatter(xs[size_marker], ys[size_marker], c="None", s=20, linewidth=1, edgecolor="gray", zorder=-15, label="Type A"); ax = plt.scatter(xs[~size_marker], ys[~size_marker], c="None", s=40, linewidth=1, edgecolor="gray", zorder=-15, label="Type B"); plt.legend(loc="upper right") plt.grid(alpha=0.6, zorder=-20) plt.title(cmap)plt.tight_layout() |
3.1.2 ”跨度“轴标签
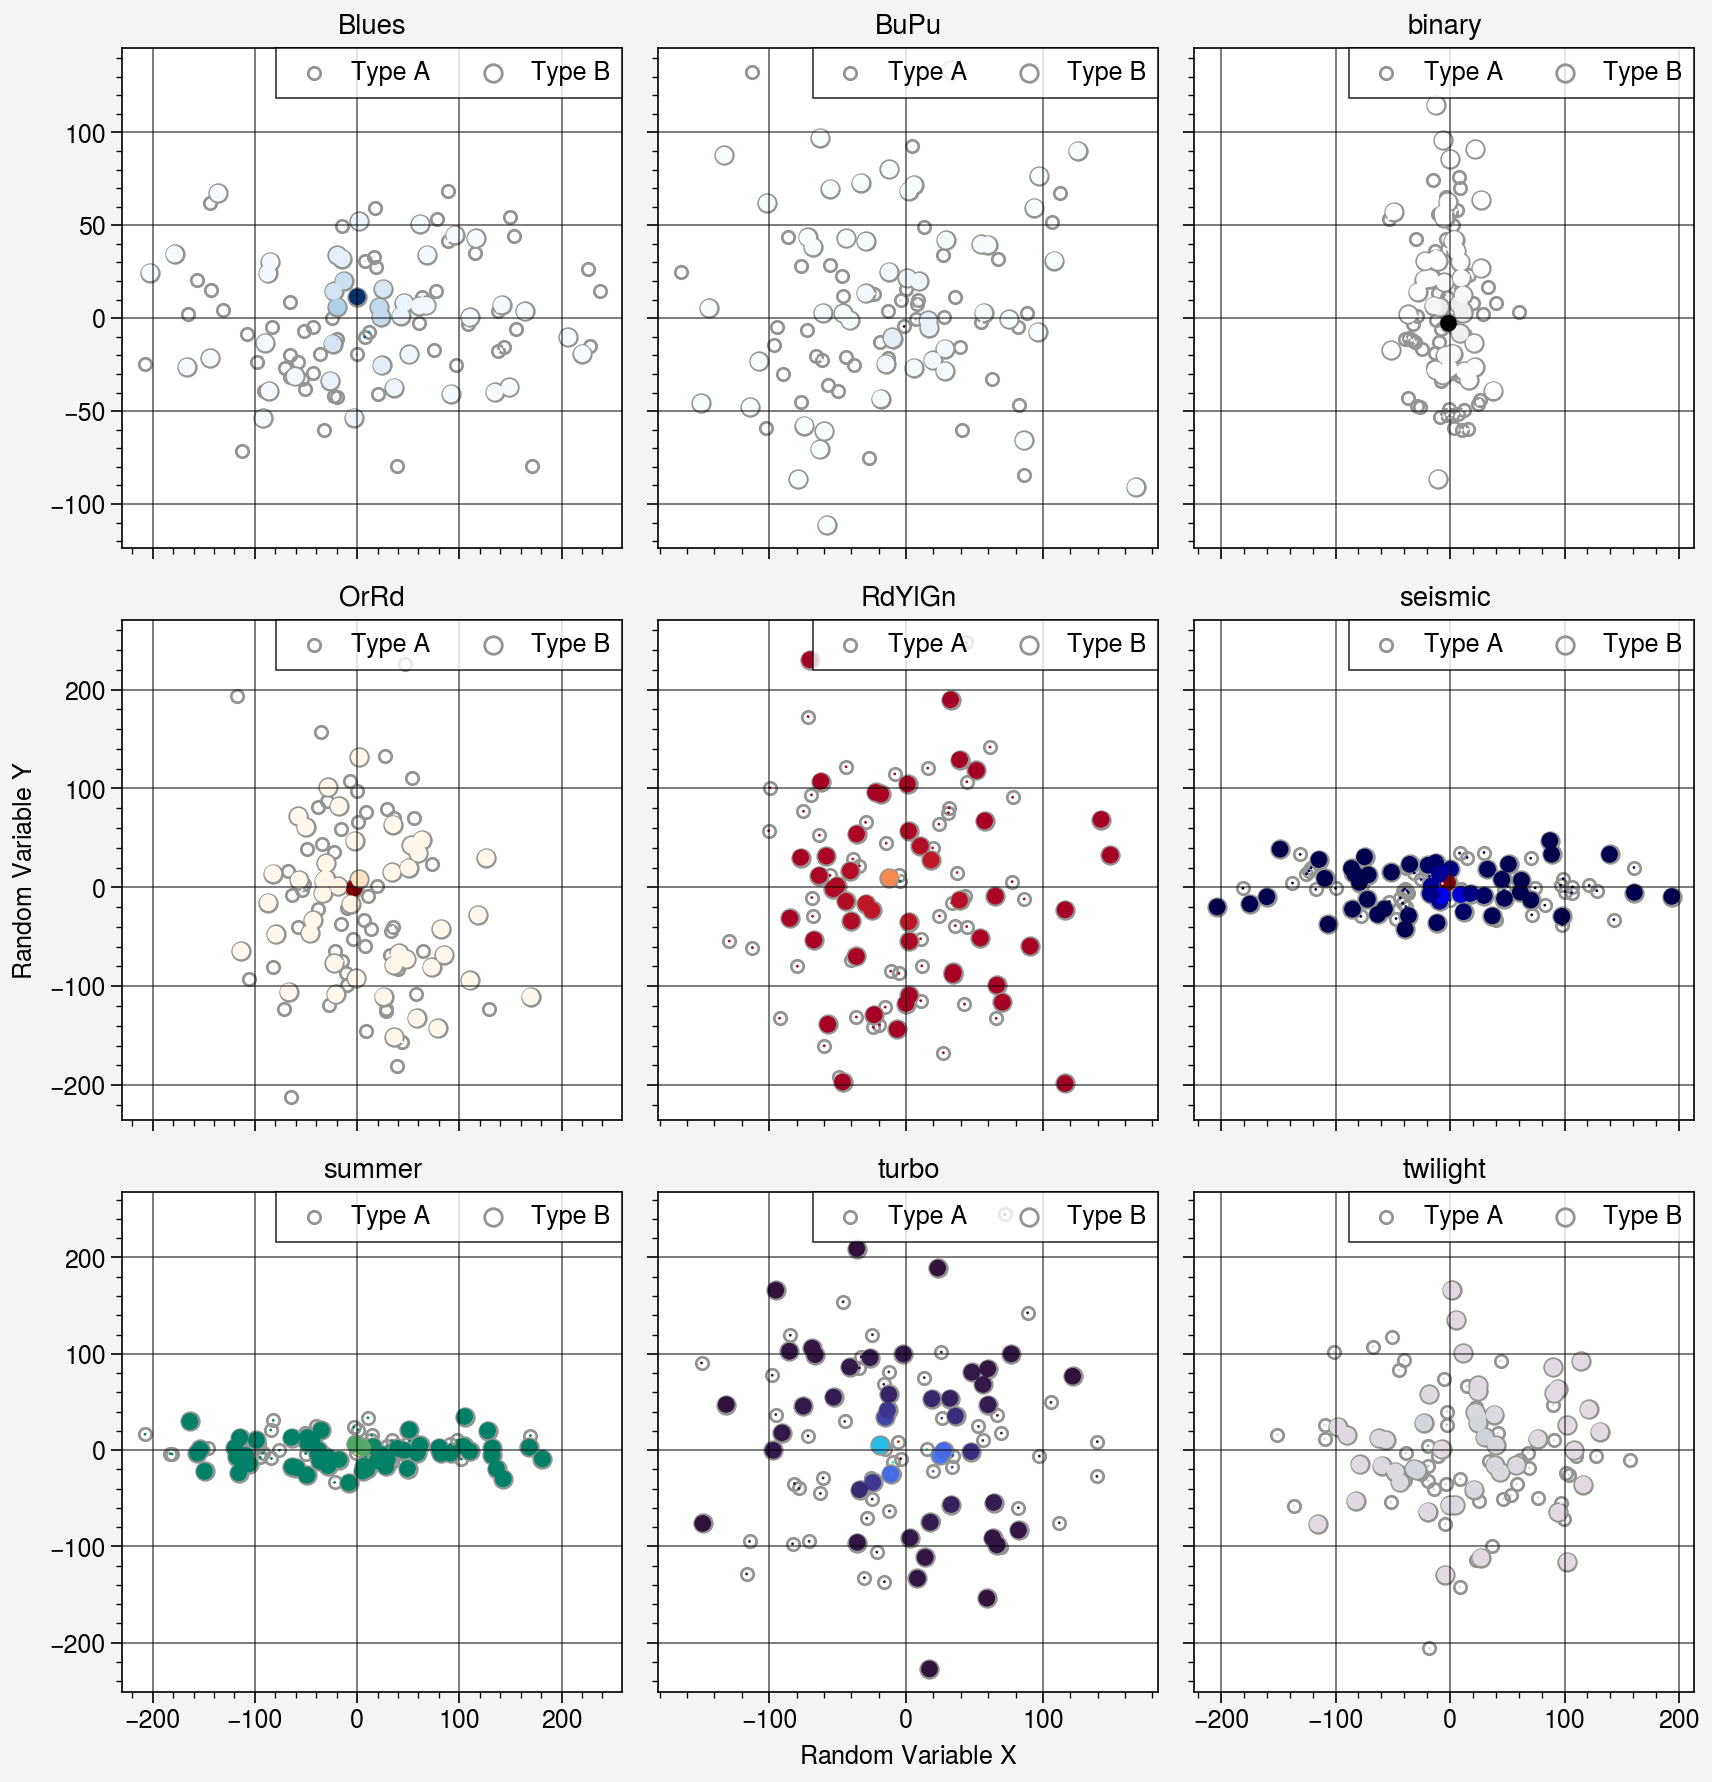
绘制多子图是常常需要在多个子图的两轴重复绘制相同的标签,但要在 matplotlib 中强制绘制居中的共有标签比较困难。proplot中figure()函数提供spanx,spany,span用于控制是否在x轴、y轴或两轴使用”跨度“轴标签。
import proplot as pplimport matplotlib.pyplot as pltimport numpy as npfrom tqdm import tqdmcmaps = ['Blues', 'BuPu', 'binary', 'OrRd', 'RdYlGn', 'seismic', 'summer', 'turbo', 'twilight']plt.figure(figsize=(20, 16), dpi=300)ppl.figure(share=3, span=True)for idx, cmap in tqdm(enumerate(cmaps)): xs = np.random.randn(100) * np.random.randint(2, 100) ys = np.random.randn(100) * np.random.randint(2, 100) size_marker = np.random.rand(100) > 0.5 s = 40 - 20 * size_marker deg = 1 / (xs ** 2 + ys ** 2 + 1) ax = plt.subplot(3, 3, idx+1) ax = plt.scatter(xs, ys, c=deg, s=s ,cmap=cmap, linewidth=size_marker, edgecolor="None", zorder=-10); # plt.colorbar(ax) ax = plt.scatter(xs[size_marker], ys[size_marker], c="None", s=20, linewidth=1, edgecolor="gray", zorder=-15, label="Type A"); ax = plt.scatter(xs[~size_marker], ys[~size_marker], c="None", s=40, linewidth=1, edgecolor="gray", zorder=-15, label="Type B"); plt.legend(loc="upper right") plt.xlabel(r"Random Variable $X$") plt.ylabel(r"Random Variable $Y$") plt.grid(alpha=0.6, zorder=-20) plt.title(cmap)plt.tight_layout() |
3.1.3 多子图序号的绘制
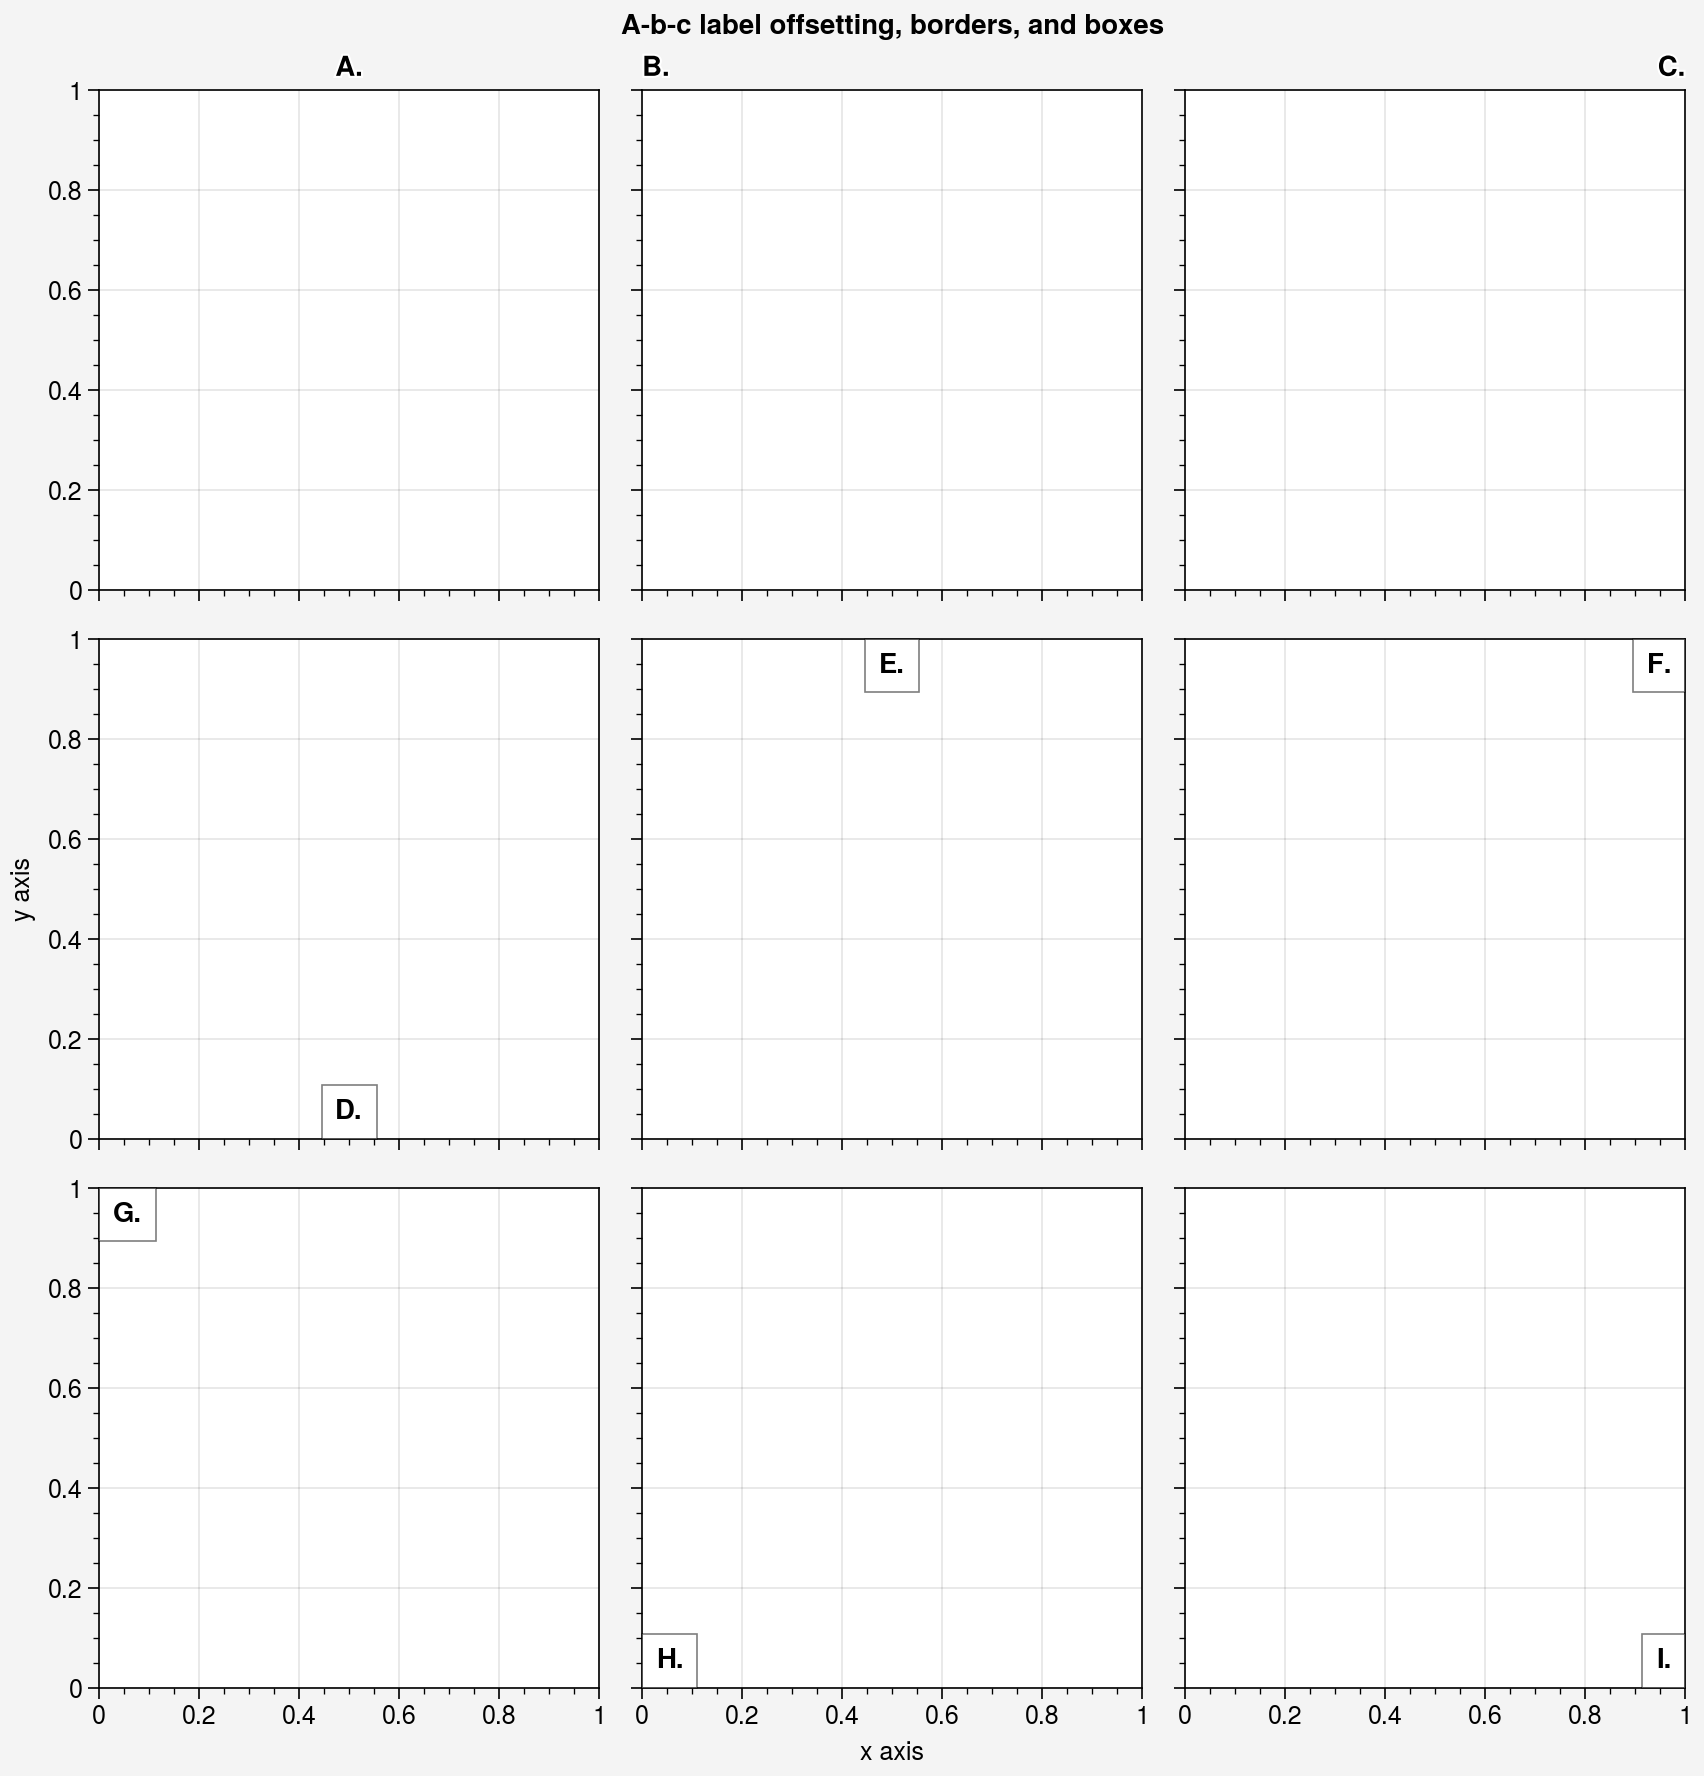
proplot提供灵活的格式化刚噶,可以控制多子图的序号位置。
| 控制字符串 | 简写 | 子图序号在子图中的位置 |
|---|---|---|
"center" |
'c' |
上轴上方中间 |
"left" |
'l' |
上轴上方左侧 |
"right" |
'r' |
上轴上方右侧 |
"lower center" |
"lc" |
下轴上方中间 |
"upper center" |
"uc" |
上轴下方中间 |
"upper right" |
"ur" |
上轴下方右侧 |
"upper left" |
"ul" |
上轴下方左侧 |
"lower left" |
"ll" |
下轴上方左侧 |
"lower right" |
"lr" |
下轴上方左侧 |
import proplot as pplimport matplotlib.pyplot as pltimport numpy as npfig = ppl.figure(abc=True)axs = fig.subplots(ncols=3, nrows=3)print(axs)axs.format( abc='A.', abcloc='ul', xlabel='x axis', ylabel='y axis', suptitle='A-b-c label offsetting, borders, and boxes',)ls = ['c', 'l', 'r', "lc", "uc", "ur", "ul", "ll", "lr"]for i, ls in enumerate(ls): axs[i].format(abcloc=ls, titleloc=ls, title="", abcbbox=True) |
3.2 更简单的颜色条和图例
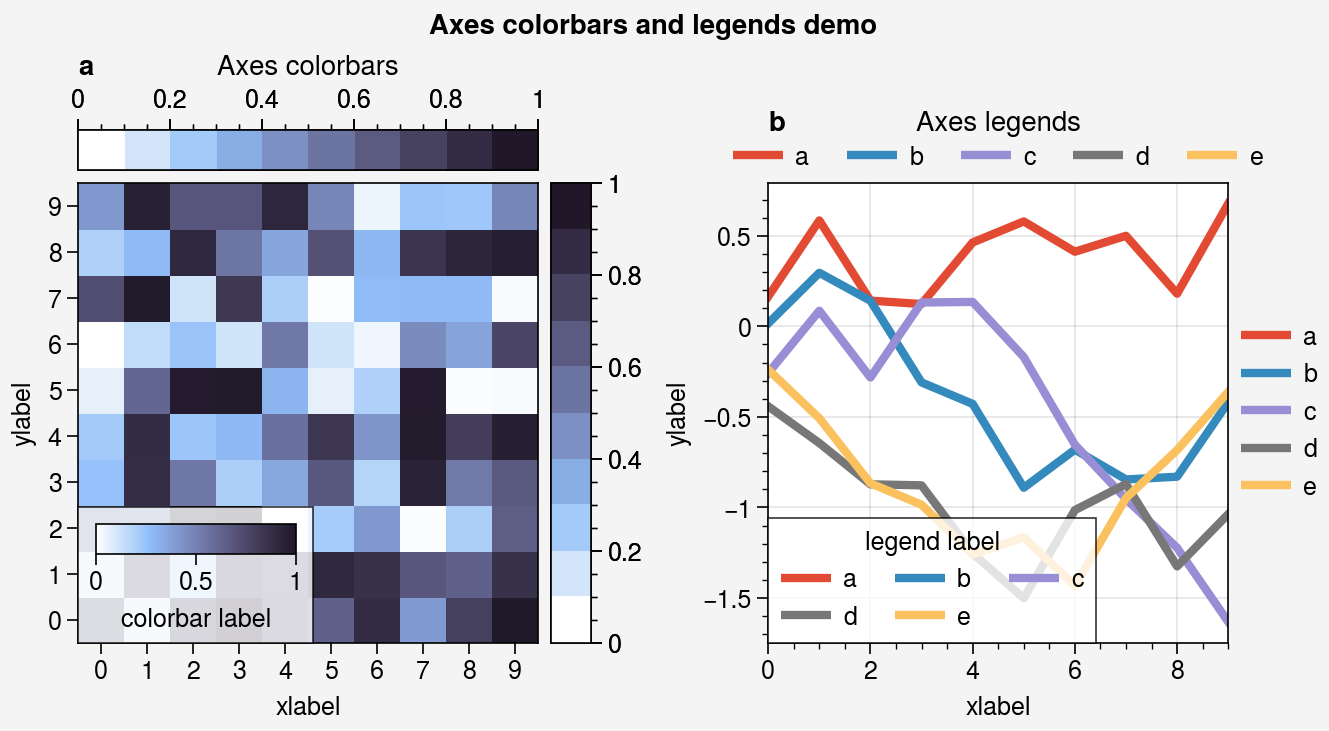
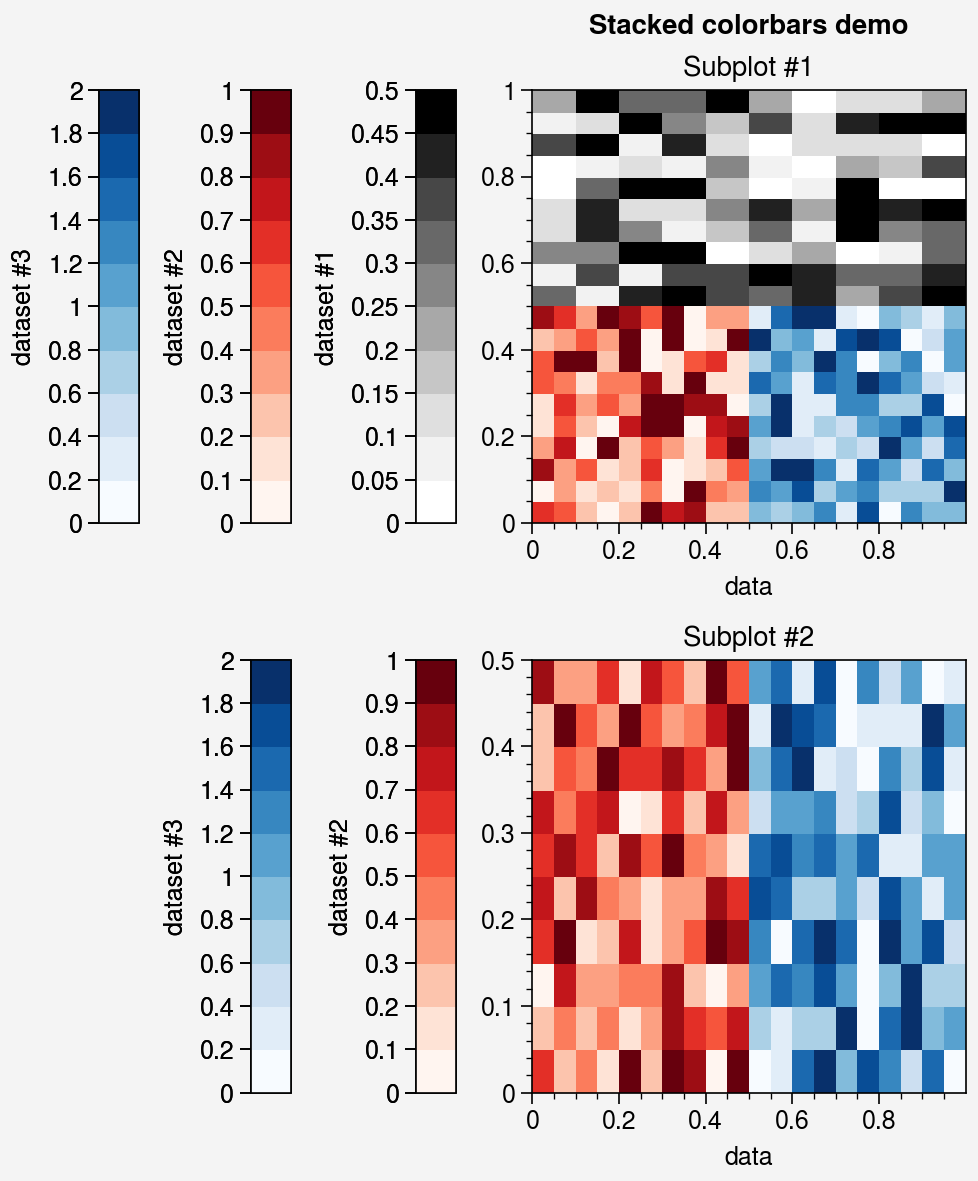
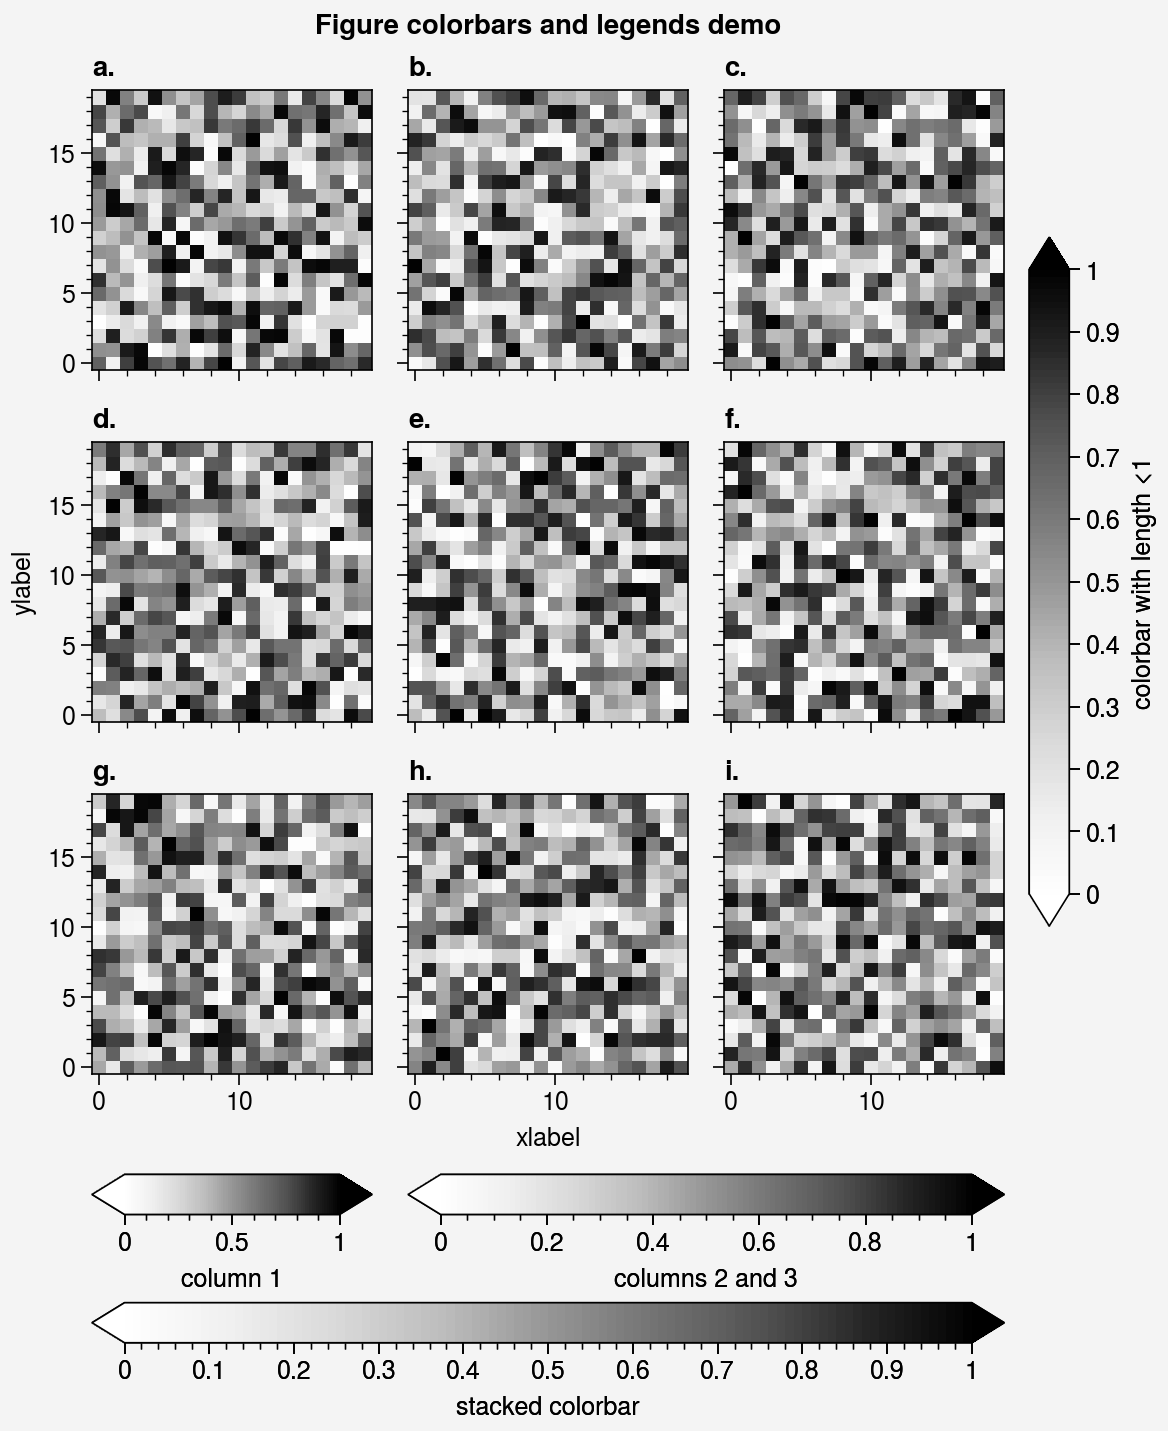
proplot拥有简单绘制colorbar和legend的框架proplot.figure.Figure.colorbar和proplot.figure.Figure.legend,可以将框架位置传入下层的axes.Axes.colorbar或者axes.Axes.legend,完成绘制工作。
import proplot as ppltimport numpy as npfig = pplt.figure(share=False, refwidth=2.3)# 不同位置的 Colorbarax = fig.subplot(121)state = np.random.RandomState(51423)m = ax.heatmap(state.rand(10, 10), colorbar='t', cmap='dusk')ax.colorbar(m, loc='r')# 添加右侧,默认出现在上面ax.colorbar(m, loc='ll', label='colorbar label')# 添加左下角ax.format(title='Axes colorbars', suptitle='Axes colorbars and legends demo')# 不同位置的 Legendax = fig.subplot(122)ax.format(title='Axes legends', titlepad='0em')hs = ax.plot( (state.rand(10, 5) - 0.5).cumsum(axis=0), linewidth=3, cycle='ggplot', legend='t', labels=list('abcde'), legend_kw={'ncols': 5, 'frame': False})ax.legend(hs, loc='r', ncols=1, frame=False)ax.legend(hs, loc='ll', label='legend label')fig.format(abc=True, xlabel='xlabel', ylabel='ylabel') |
import proplot as ppltimport numpy as npN = 10state = np.random.RandomState(51423)fig, axs = pplt.subplots( nrows=2, share=False, refwidth='55mm', panelpad='1em', suptitle='Stacked colorbars demo')# 堆叠的 Colorbarargs1 = (0, 0.5, 1, 1, 'grays', 0.5)# 对应网格的上半部分args2 = (0, 0, 0.5, 0.5, 'reds', 1)# 对应网格的左下角args3 = (0.5, 0, 1, 0.5, 'blues', 2)# 对应网格的右下角for j, ax in enumerate(axs): ax.format(xlabel='data', xlocator=np.linspace(0, 0.8, 5), title=f'Subplot #{j+1}') for i, (x0, y0, x1, y1, cmap, scale) in enumerate((args1, args2, args3)): if j == 1 and i == 0: continue data = state.rand(N, N) * scale x, y = np.linspace(x0, x1, N + 1), np.linspace(y0, y1, N + 1) m = ax.pcolormesh(x, y, data, cmap=cmap, levels=np.linspace(0, scale, 11)) ax.colorbar(m, loc='l', label=f'dataset #{i+1}') |
import proplot as ppltimport numpy as npstate = np.random.RandomState(51423)fig, axs = pplt.subplots(ncols=3, nrows=3, refwidth=1.4)for ax in axs: m = ax.pcolormesh(state.rand(20, 20), cmap='grays', levels=np.linspace(0, 1, 11), # 设置 colorbar 的层级 extend='both'# 设置 colorbar 为上下均为三角形 # extend 参数还可以设置为 "min", "max" 和 "neither"(默认) )fig.format(suptitle='Figure colorbars and legends demo', abc='a.', abcloc='l', xlabel='xlabel', ylabel='ylabel')# 定位在第一列,最下方fig.colorbar(m, label='column 1', ticks=0.5, loc='b', col=1 )# 横跨第二列和第三列,最下方fig.colorbar(m, label='columns 2 and 3', ticks=0.2, loc='b', cols=(2, 3))# 堆叠在上面两个 colorbar 的下方,并设置子刻度fig.colorbar(m, label='stacked colorbar', ticks=0.1, loc='b', minorticks=0.05 )# 定位在右侧fig.colorbar(m, label='colorbar with length <1', ticks=0.1, loc='r', length=0.7 ) |
3.3 更加美观的颜色和字体
3.3.1 颜色映射
3.3.1.1 内置颜色映射
fig, axs = pplt.show_cmaps(rasterize=True) |

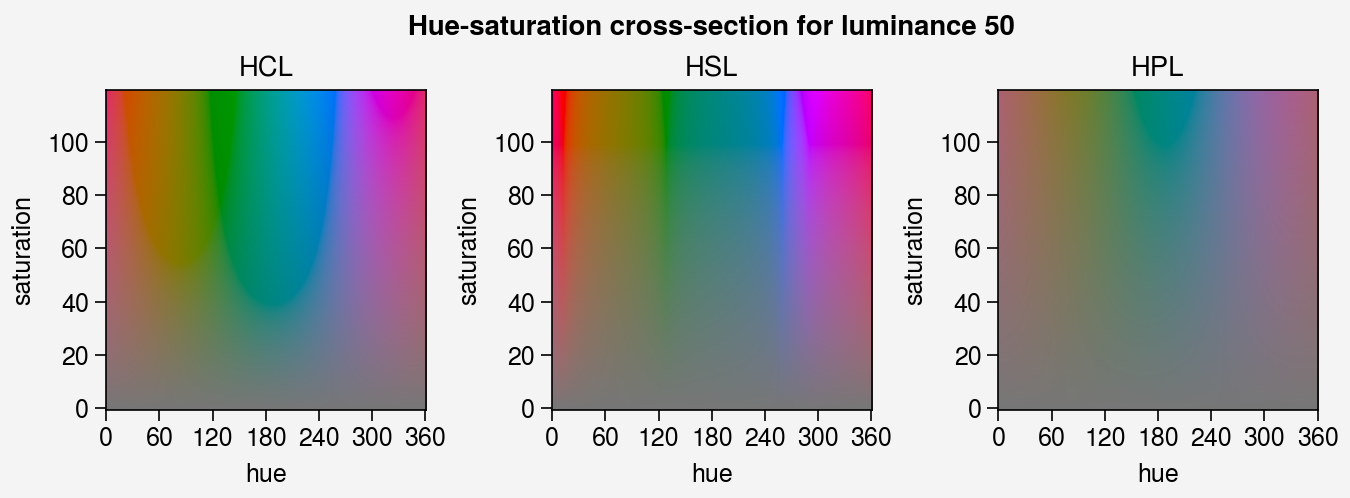
3.3.1.2 感知均匀色彩空间
# Colorspace demoimport proplot as ppltfig, axs = pplt.show_colorspaces(refwidth=1.6, luminance=50)fig, axs = pplt.show_colorspaces(refwidth=1.6, saturation=60)fig, axs = pplt.show_colorspaces(refwidth=1.6, hue=0) |
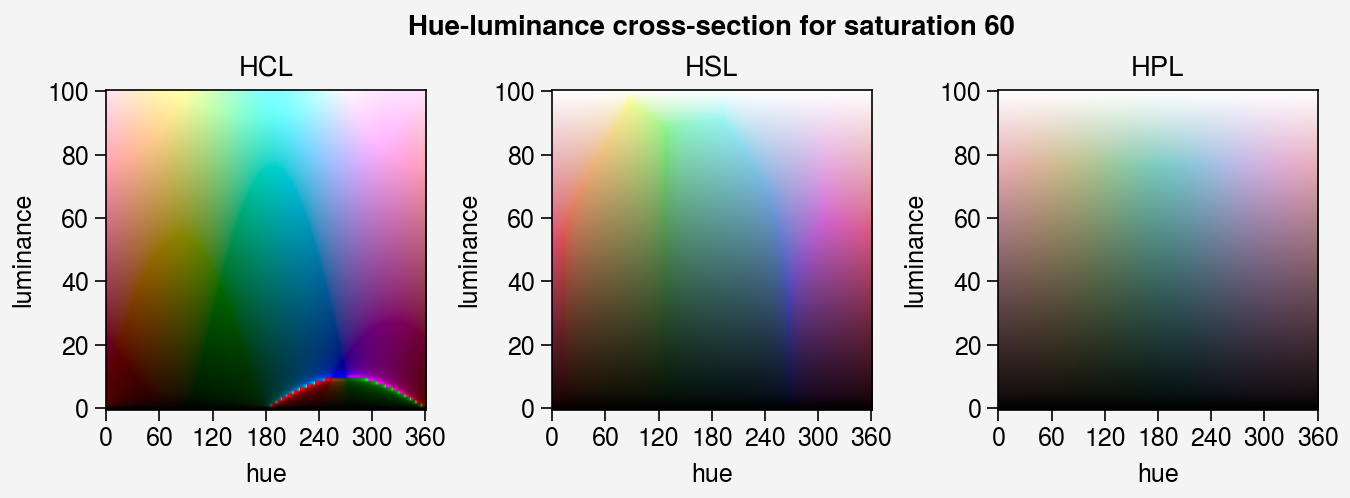
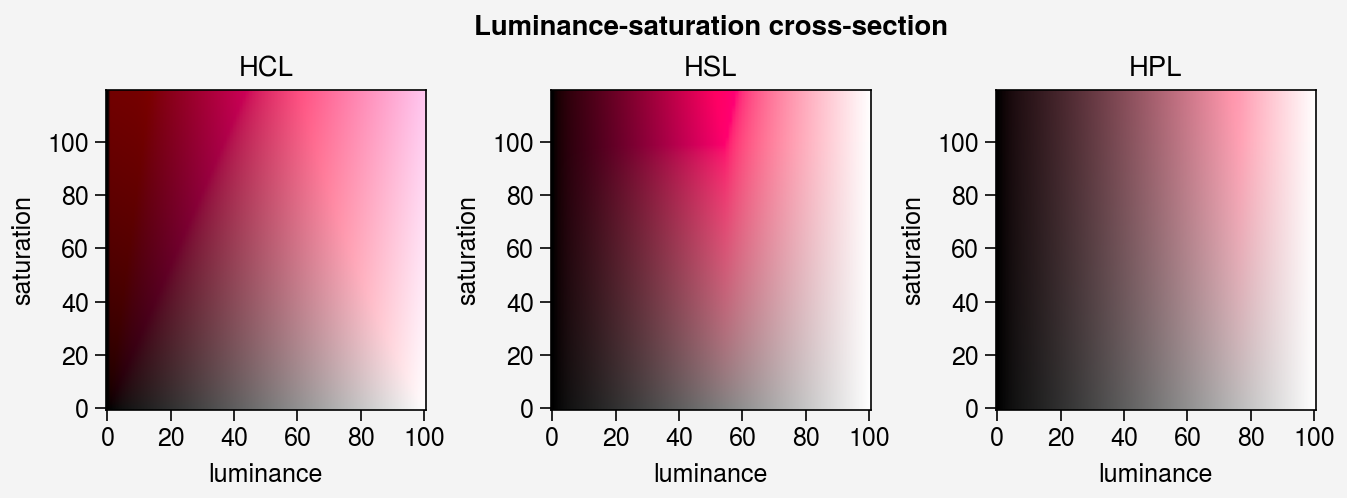
3.3.1.3 colormap的融合
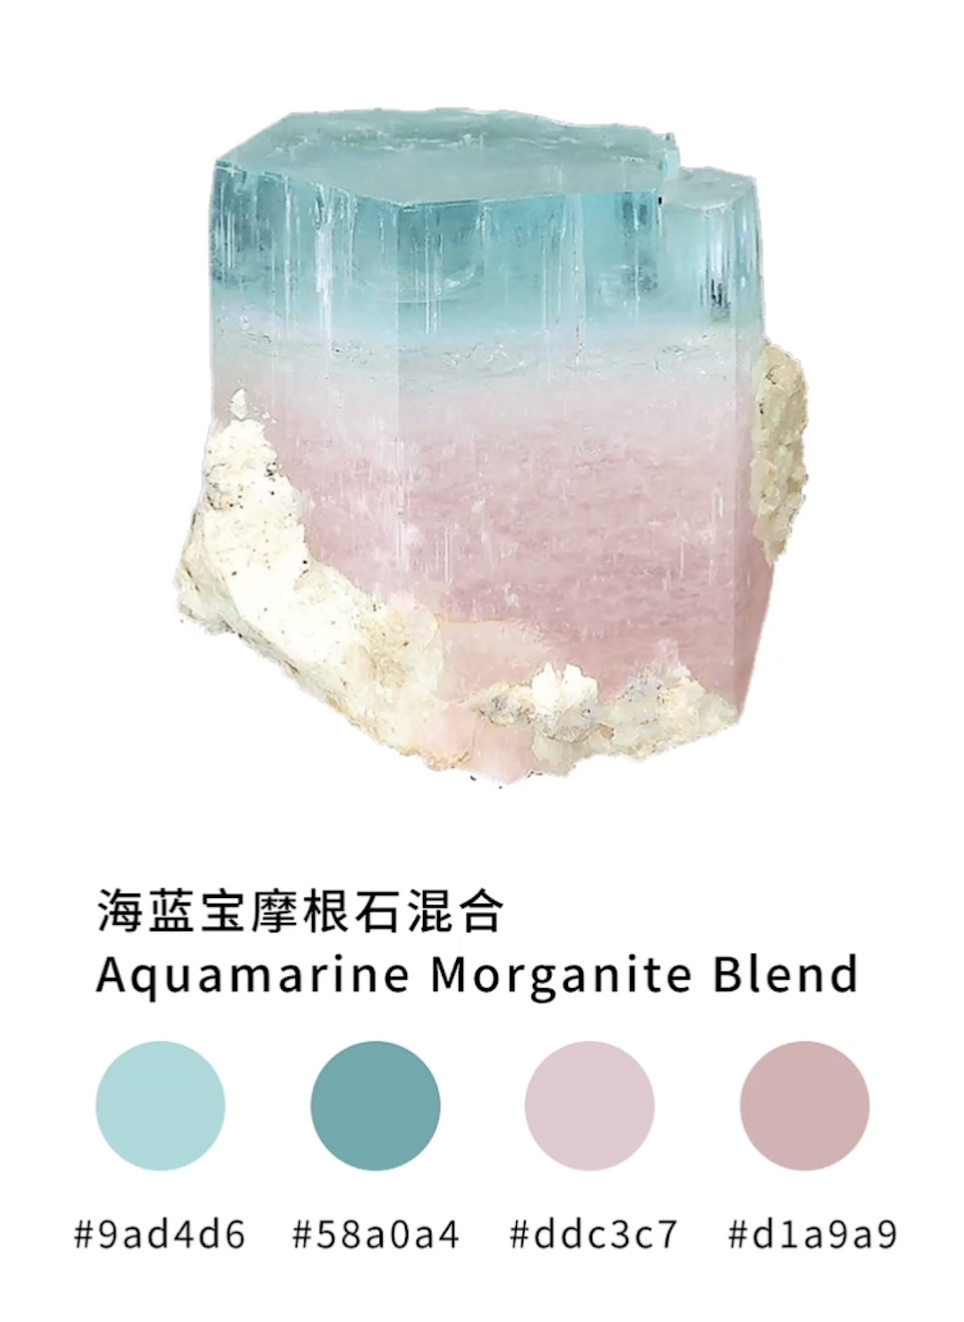
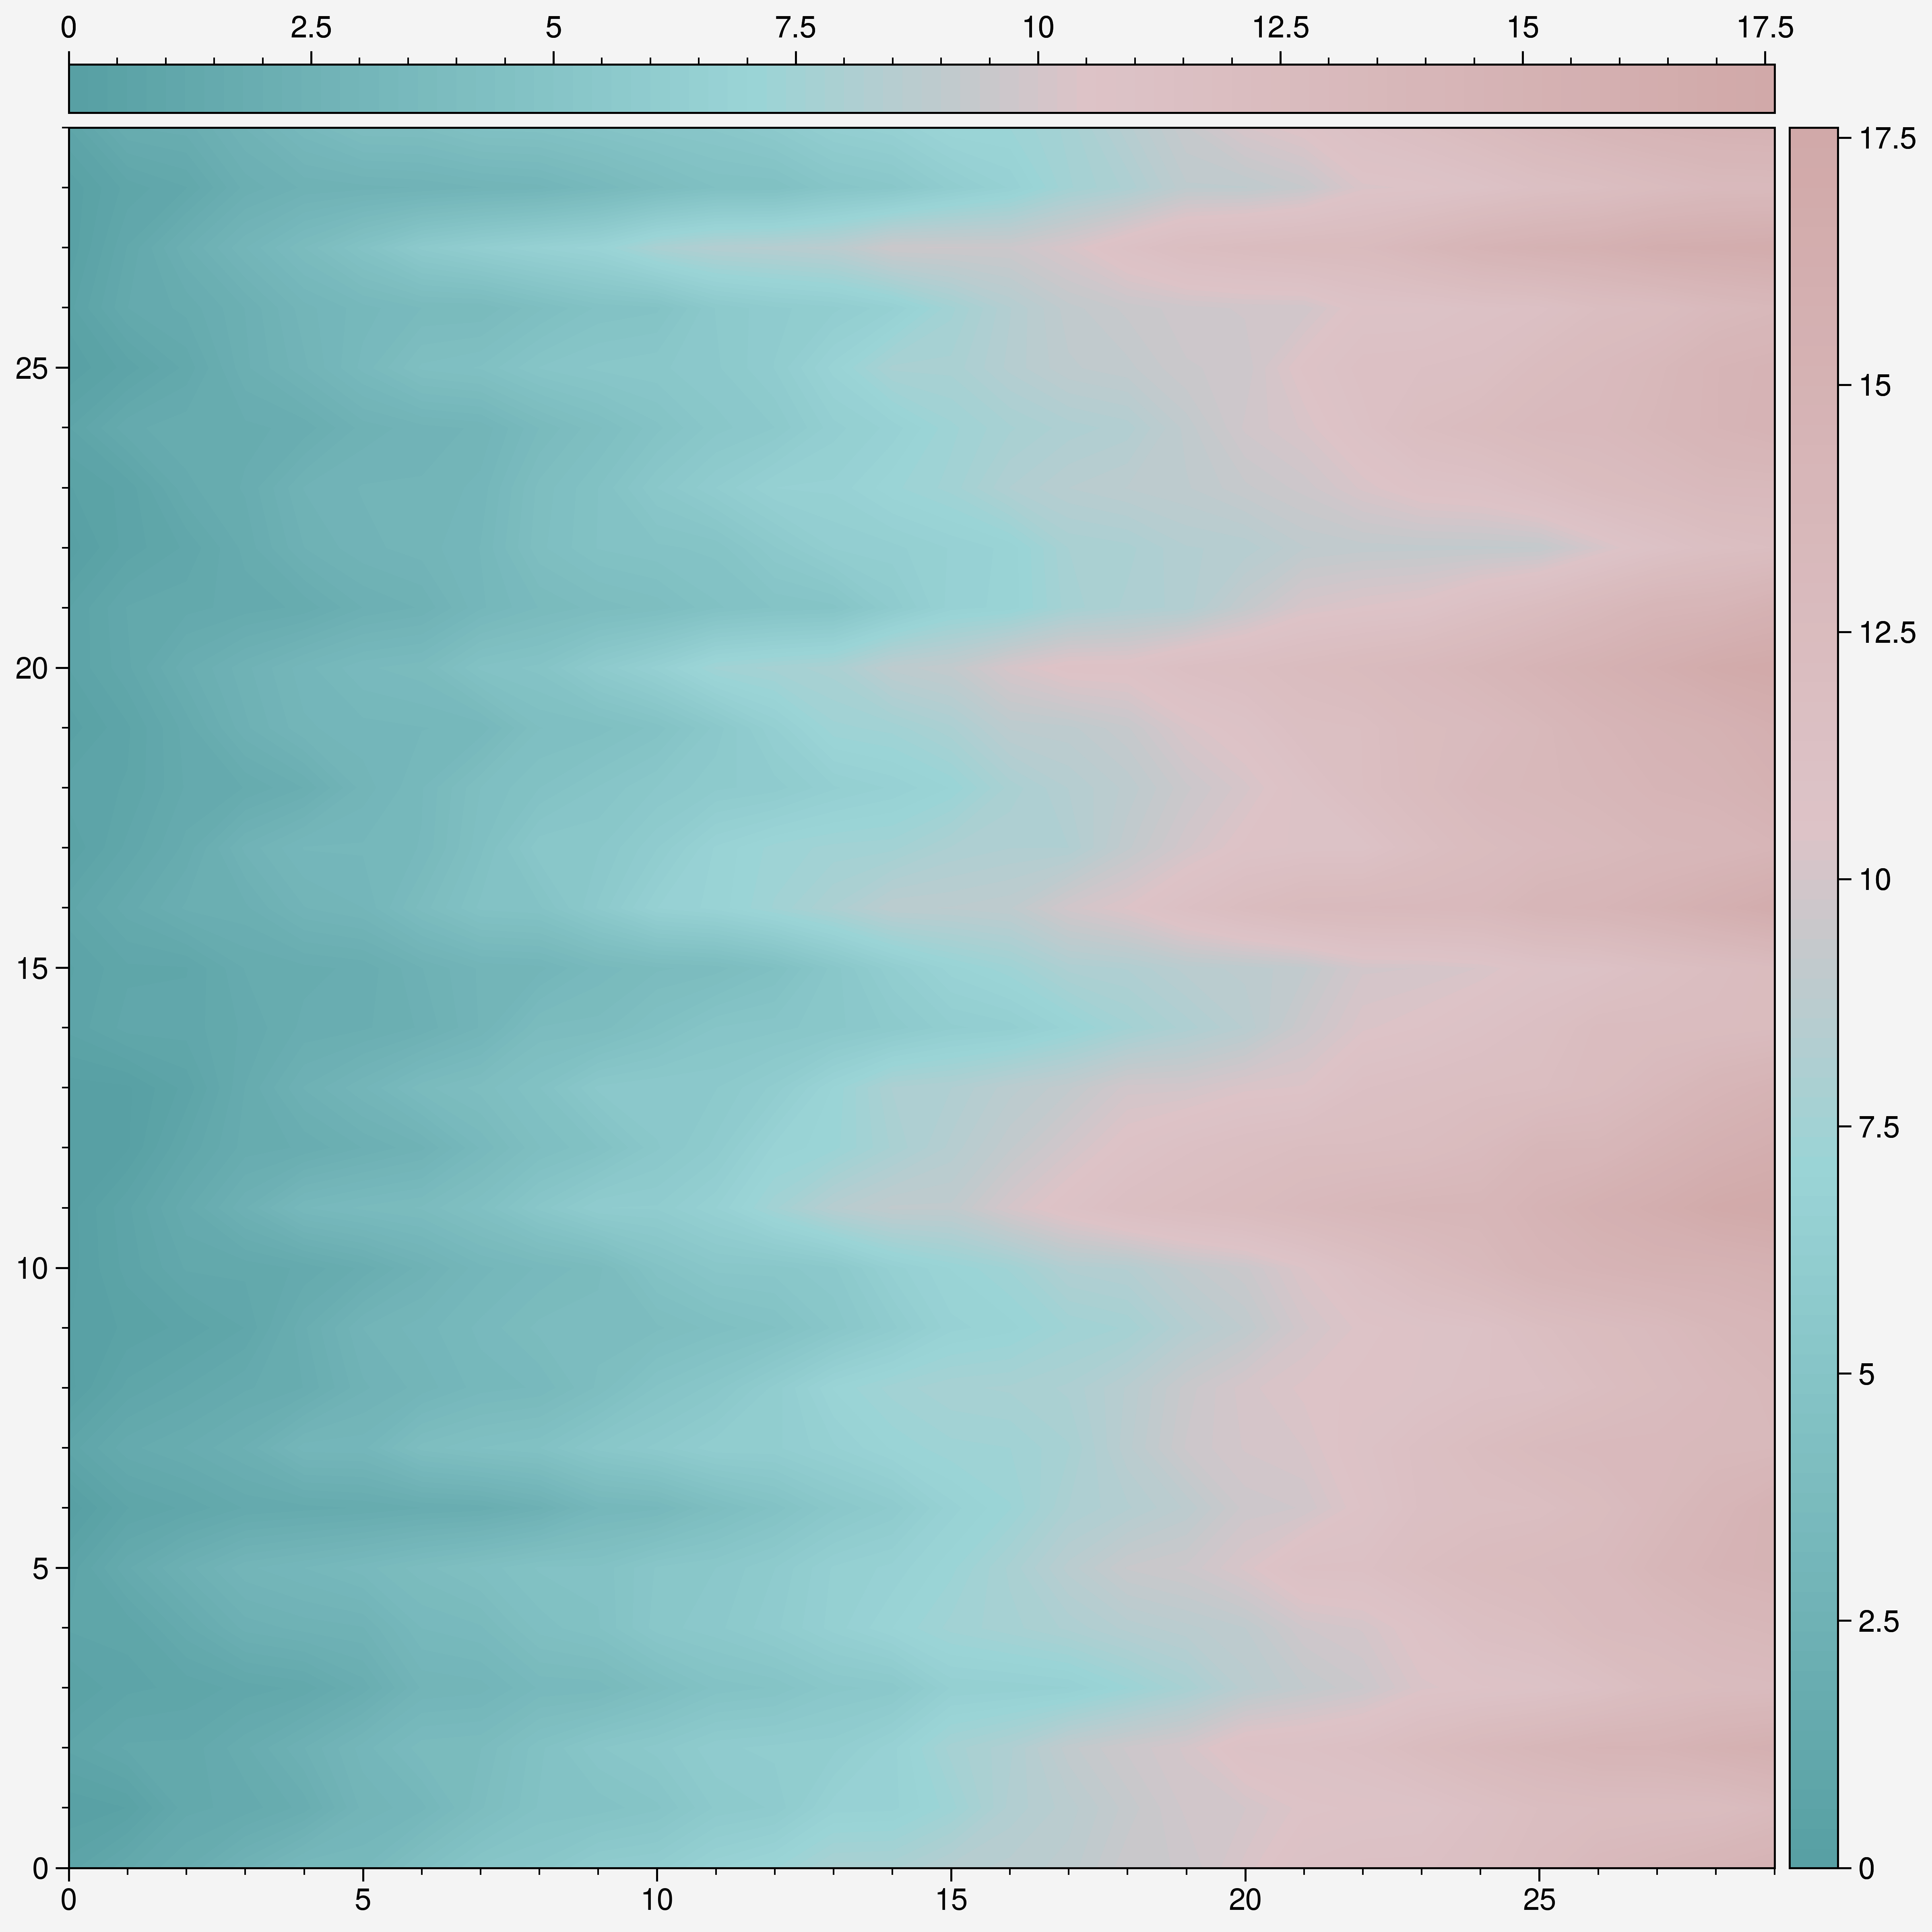
考虑如下的海蓝宝(Aquamarine)和摩根石(Morganite)颜色的混合(来源):
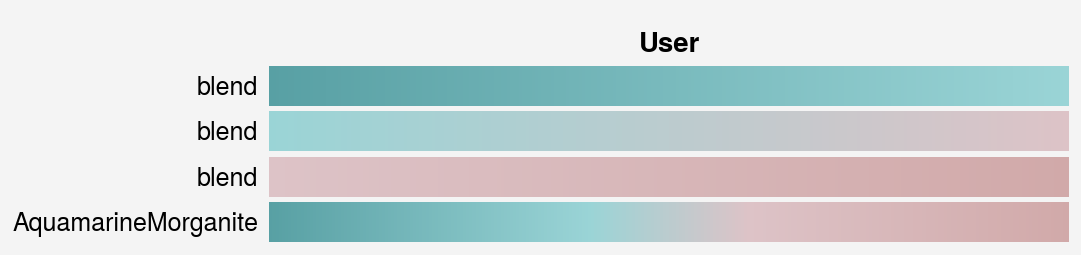
import seaborn as snscmap1 = sns.color_palette("blend:#58A0A4,#9AD4D6", as_cmap=True)cmap2 = sns.color_palette("blend:#9AD4D6,#DDC3C7", as_cmap=True)cmap3 = sns.color_palette("blend:#DDC3C7,#D1A9A9", as_cmap=True)cmap4 = pplt.Colormap( cmap1, cmap2, cmap3, name='AquamarineMorganite', ratios = (4, 2, 4), save=True)fig, ax = pplt.show_cmaps(cmap1, cmap2, cmap3, "AquamarineMorganite") |
state = np.random.RandomState(114514)data = state.rand(30, 30).cumsum(axis=1)fig, ax = pplt.subplots(nrows=1, ncols=1, dpi=300, figsize=(8, 8) )m = ax.contourf(data, cmap="AquamarineMorganite", levels=100)ax.grid(False)ax.colorbar(m, loc='top', ticks=2.5)ax.colorbar(m, ticks=2.5) |
3.3.2 字体
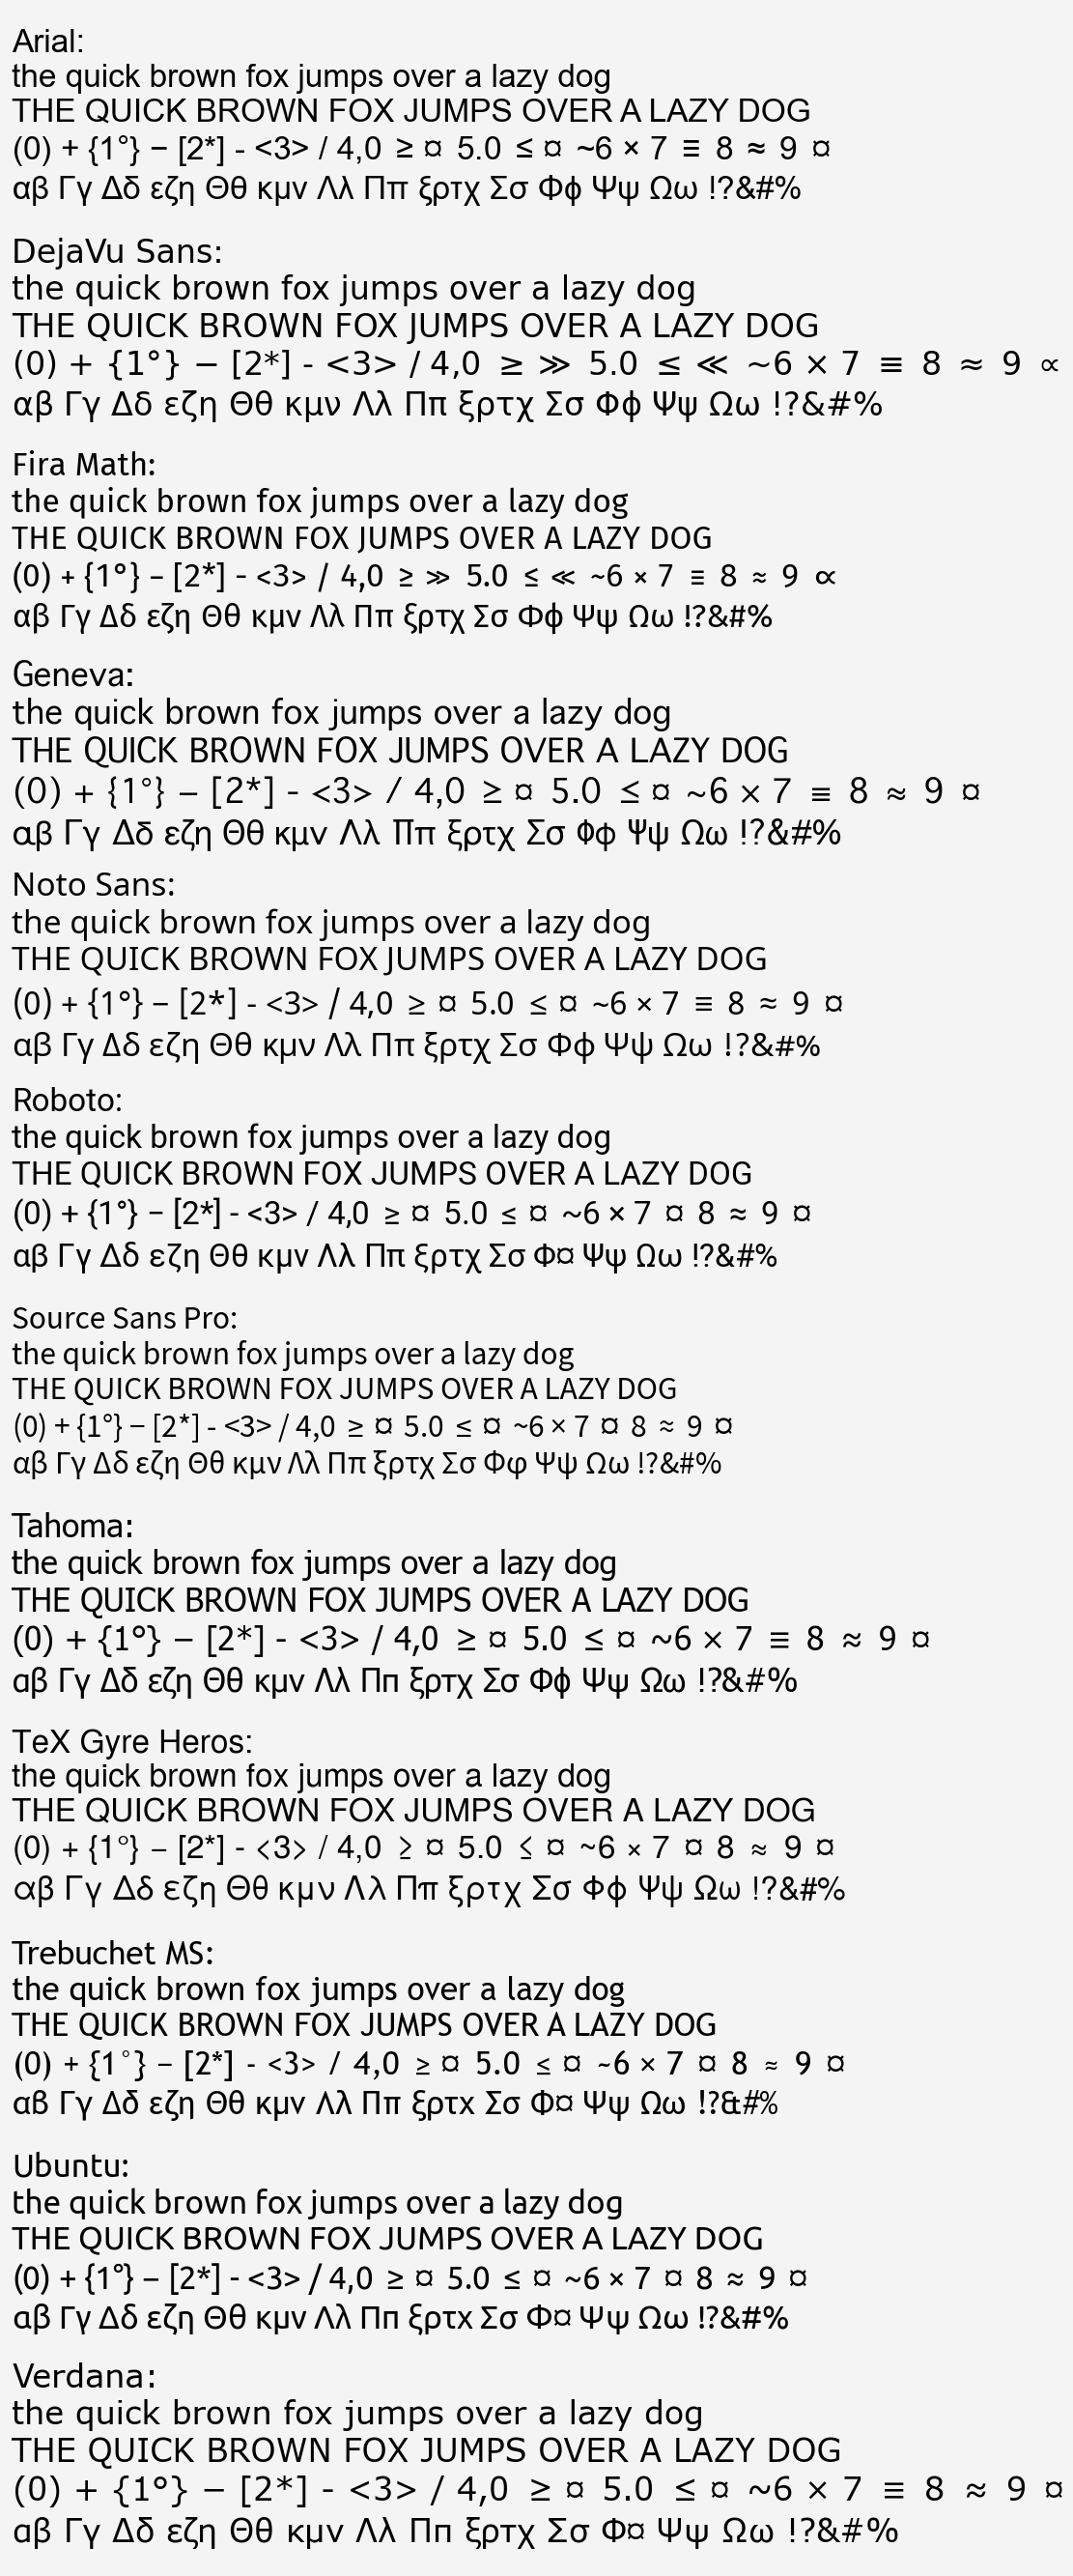
内置字体列表
pplt.show_fonts() |
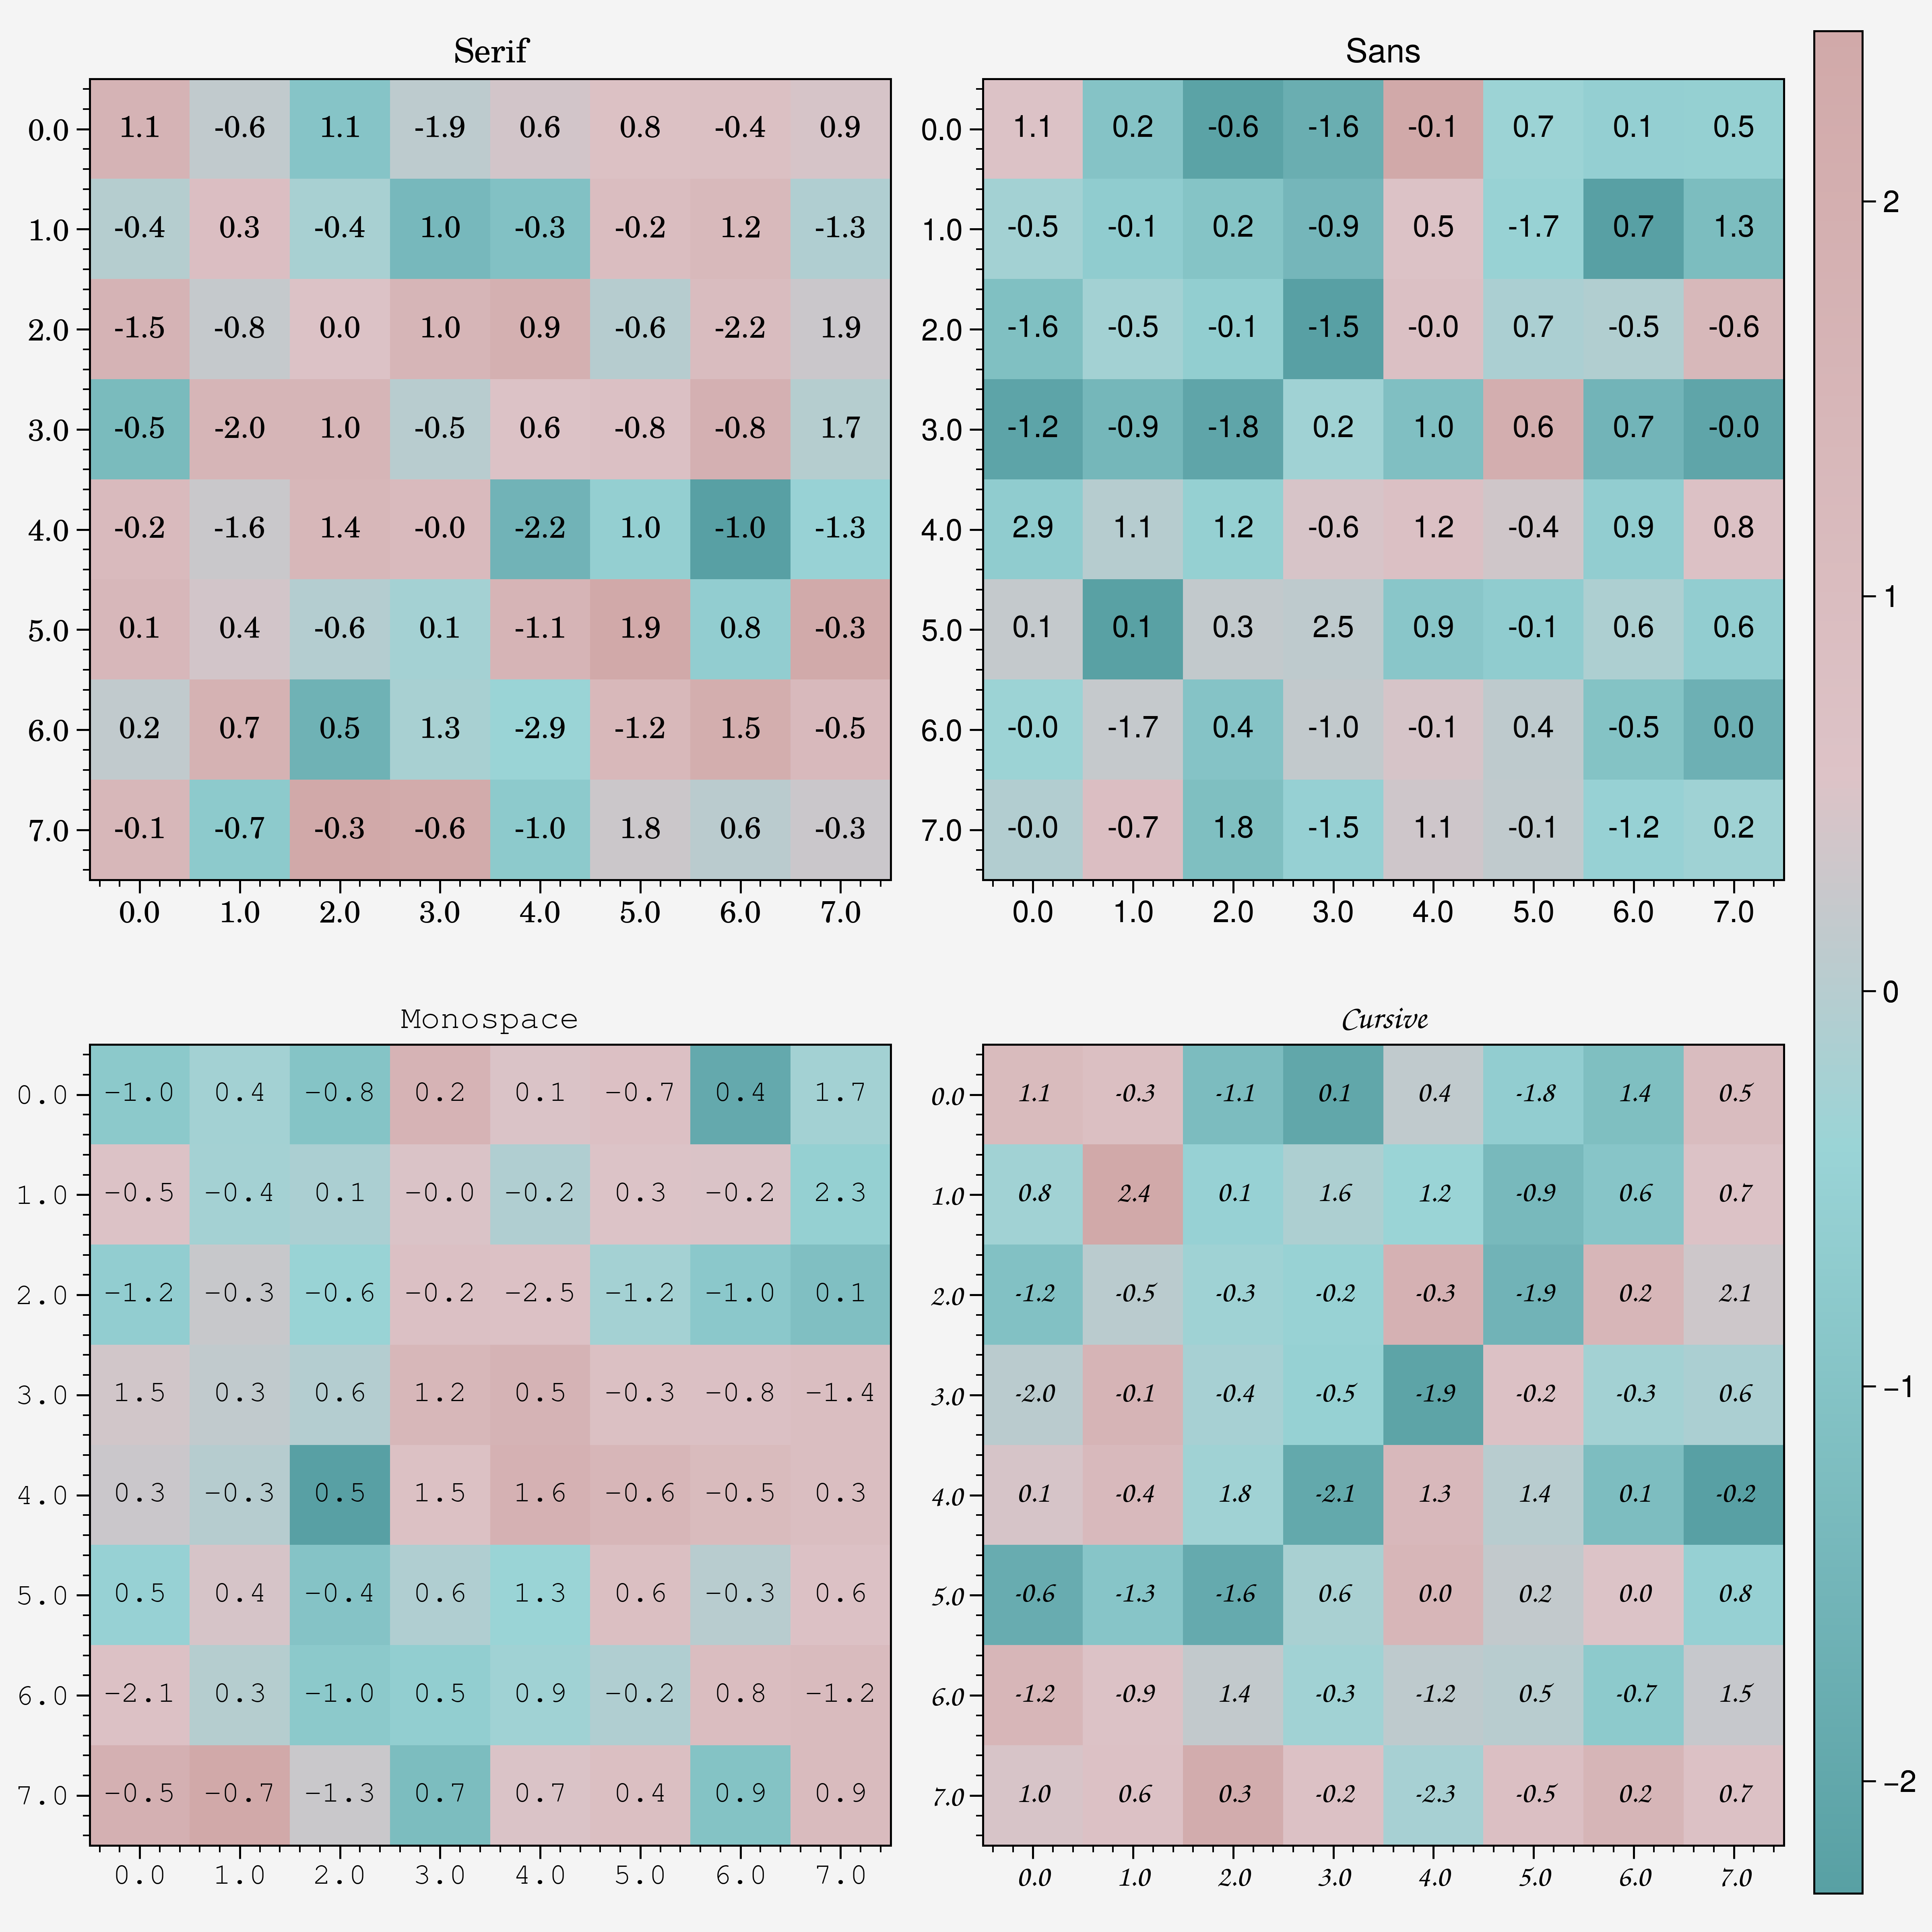
from itertools import permutationsfrom matplotlib import axesfrom torch import permutedef font_text(ax, x, y, text, family, **kwargs): ax.textfonts = ["Serif", "Sans", "Monospace", "Cursive"]fig, axs = pplt.subplots(nrows=2, ncols=2, share=False, rc_kw={"font.family":fonts}, dpi=300, figsize=(8, 8))for idx, font in enumerate(fonts): arr = np.random.randn(8, 8) m = axs[idx].imshow(arr, cmap="AquamarineMorganite") axs[idx].grid(False) axs[idx].format(title=f"{font}", title_kw={"family":font}) axs[idx].set_xticklabels(axs[idx].get_xticks(), font=dict(family=font)) axs[idx].set_yticklabels(axs[idx].get_yticks(), font=dict(family=font)) for i, j in list(permutations(range(8), 2)) + [(i, i) for i in range(8)]: axs[idx].text(i, j, f"{arr[i, j]:.1f}", horizontalalignment="center", verticalalignment="center", family=font)fig.colorbar(m) |